Modeling the shape of citrus and their oil gland distribution
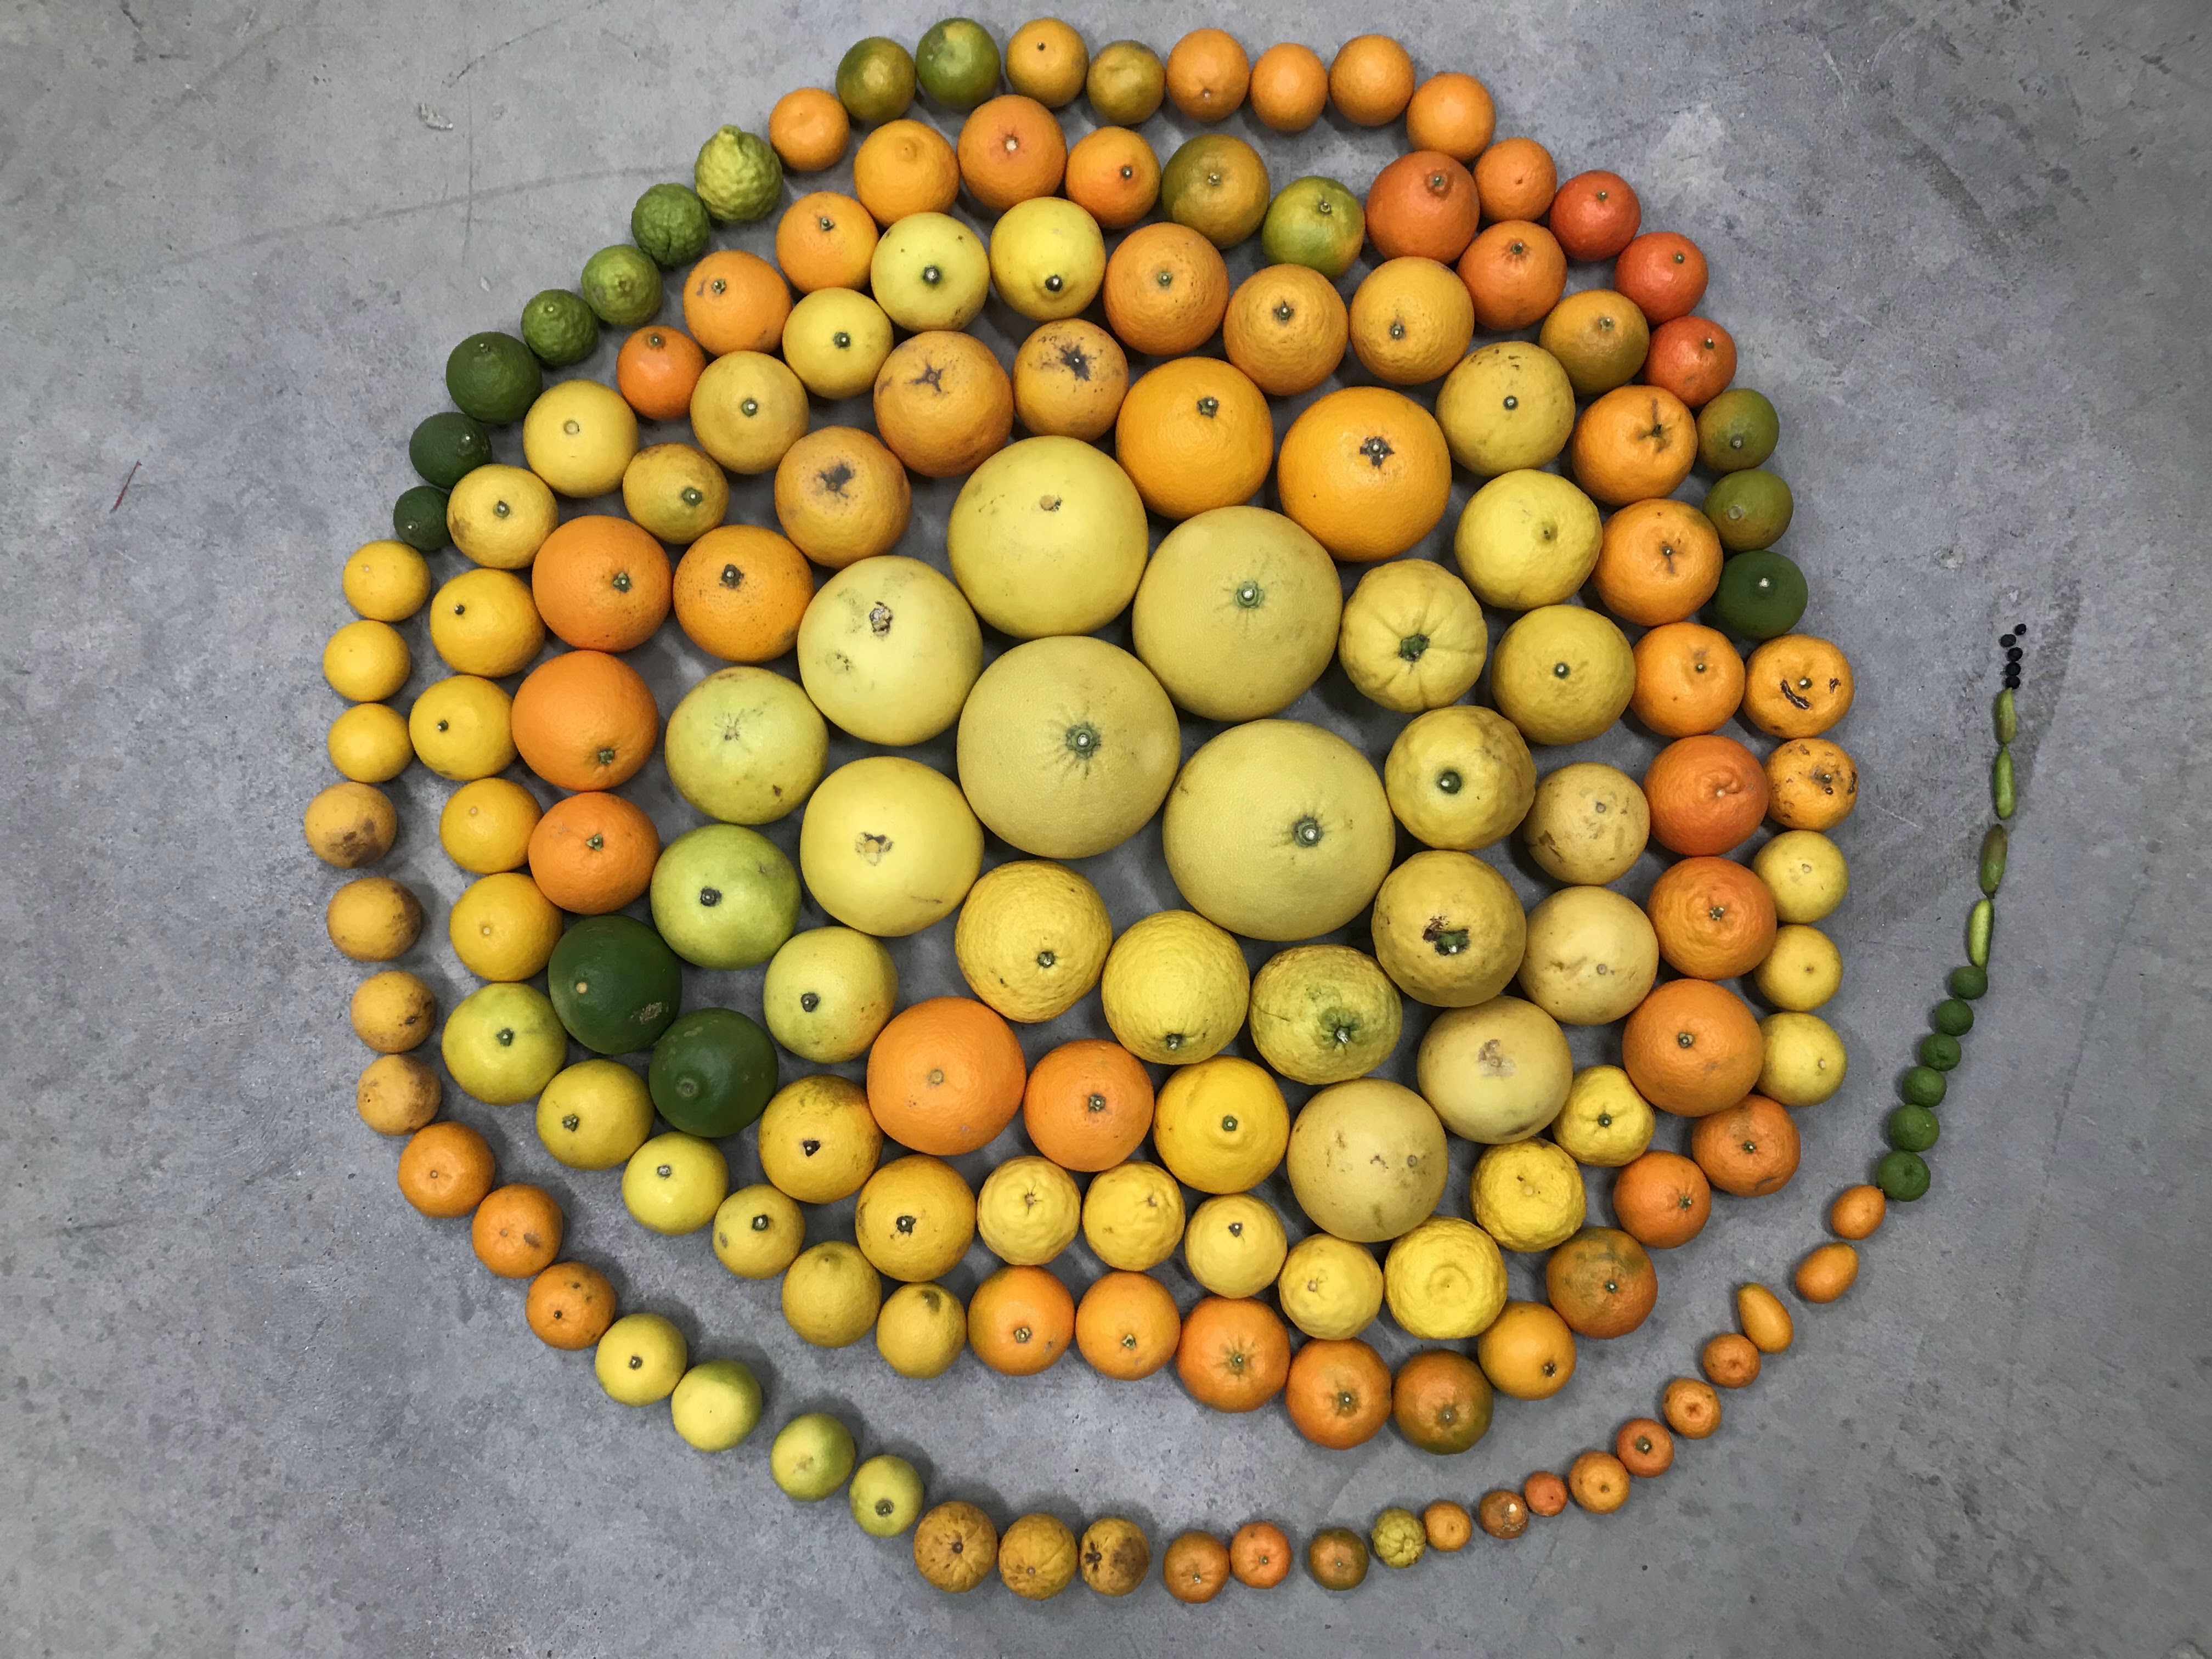
 UCR Citrus Collection
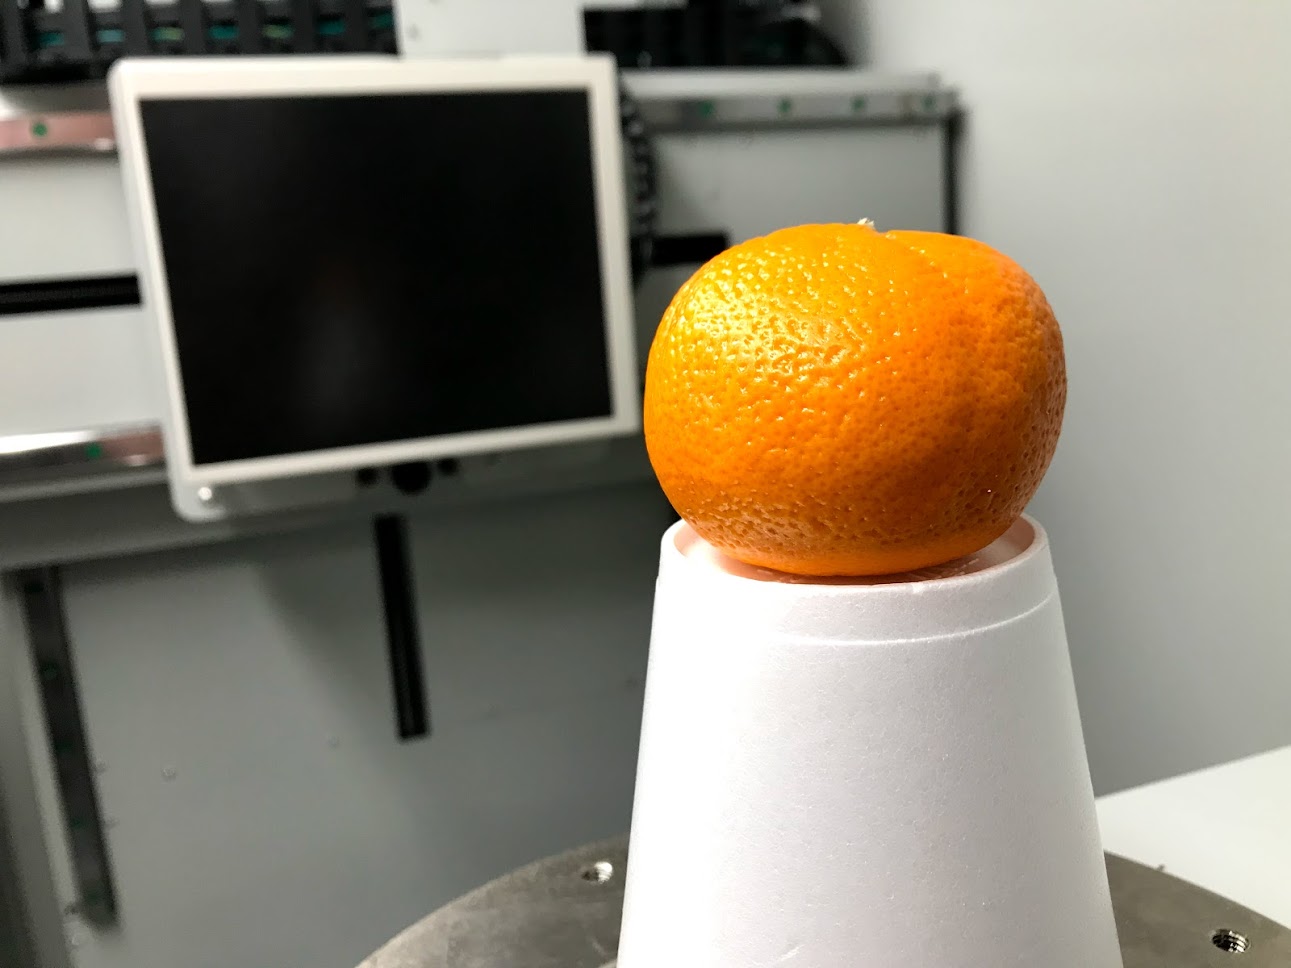
X-Ray CT Imaging
Raw 3D scans
UCR Citrus Collection
X-Ray CT Imaging
Raw 3D scans
 Spine
Endocarp
Rind
Exocarp
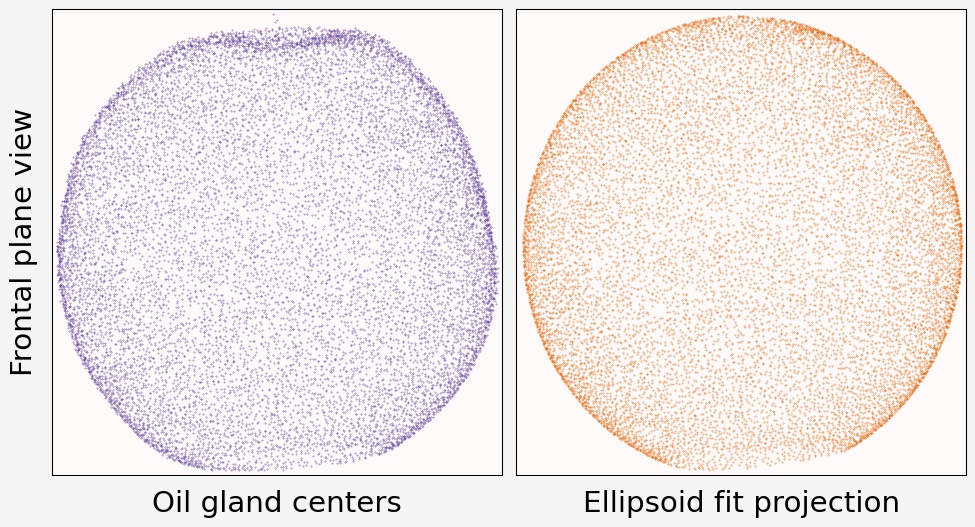
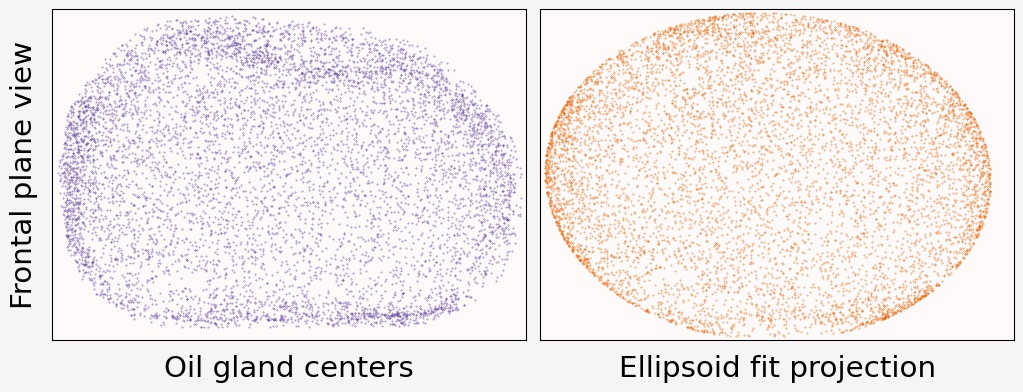
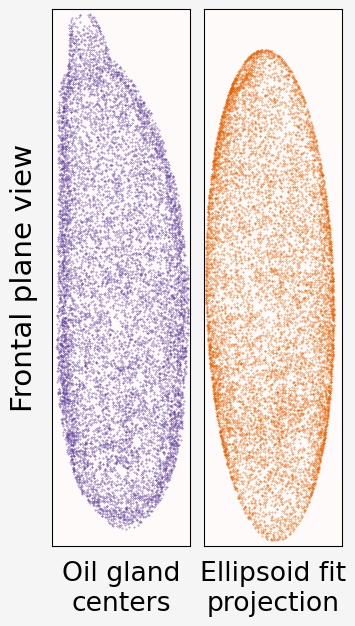
Oil glands
Spine
Endocarp
Rind
Exocarp
Oil glands