class: center, middle, inverse, title-slide .title[ # Shape is data, and data is shape ] .subtitle[ ## Mathematically phenotyping shapes and patterns<br>From molecules to organisms ] .author[ ### Erik Amézquita<br>—<br>Division of Plant Science & Technology<br>Department of Mathematics<br>University of Missouri<br>— ] .date[ ### 2025-04-07 ] --- background-image: url("../../demat/figs/fam9_3.png") background-size: 100px background-position: 98% 2% # About me: From MX to MI to MO at MU ## I work across multiple disciplines and countries .left-column[  ] .right-column[ - 2013 - 2018 : Licenciatura (Bachelor): Mathematics @ Universidad de Guanajuato and CIMAT. Thesis focused on Topological Data Analysis applied to archaeology. - 2018 - 2023 : PhD: Computational Mathematics, Science, and Engineering @ Michigan State University. Dissertation: Exploring the mathematical shape of plants. **Came for the math. Stayed for the plants.** - 2023 - Present : PFFIE Postdoctoral Fellow @ Division of Plant Science & Technology (80%) / Department of Mathematics (20%) at MU. ] <br><br><br><br><br><br><br><br><br><br><br><br><br><br> --- # My work: Crossing and merging bridges <div class="row"> <div class="column" style="max-width:21%"> <a href="https://doi.org/10.1002/ppj2.20095" target="_blank"><img style="padding: 0 0 0 0;" src="../../walnuts/figs/meat_2_05.png"></a> </div> <div class="column" style="max-width:20%"> <a href="https://doi.org/10.1007/s00299-024-03337-1" target="_blank"><img style="padding: 0 0 0 0;" src="../../cuscuta/figs/4pm_rep7_plant2_v09_0401_h.jpg"></a> </div> <div class="column" style="max-width:21%"> <a href="https://doi.org/10.1002/ppj2.20095" target="_blank"><img style="padding: 0 0 0 0;" src="../figs/Infected_Cells_05G216000_red_05G092200_green.jpg"></a> </div> <div class="column" style="max-width:27%"> <a href="https://doi.org/10.1371/journal.pone.0284820" target="_blank"><img style="padding: 0 0 0 0;" src="../../nasrin/figs/lung_fpkm_meancorr_eps1.0e+06_r40_g40.png"></a> </div> </div> <div class="row"> <div class="column" style="max-width:43%"> <img style="padding: 0 0 0 0;" src="../../tutorials/figs/myzou_plnt_sci_2500.png"> <img style="padding: 0 0 0 0;" src="../../tutorials/figs/mizzou_math_drp.png"> </div> <div class="column" style="max-width:30%"> <a href="https://doi.org/10.1101/2022.10.15.512190" target="_blank"><img style="padding: 0 0 0 0;" src="../../tutorials/figs/ipg_network_r.jpg"></a> </div> <div class="column" style="max-width:25%"> <a href="https://doi.org/10.1101/2022.10.15.512190" target="_blank"><img style="padding: 0 0 0 0;" src="../../tda/figs/107-tulare.png"></a> </div> </div> <div class="list" style="font-size: 14px; text-align: left;"> <ul> <li>M Bentelspacher, <strong>EJA</strong>, S Adhikari, J Barros, SY Park (2024) "The early dodder gets the host: Decoding the coiling patterns of Cuscuta campestris with automated image processing". <em>Plant Cell Reports</em>.</li> <li><strong>EJA</strong>, MY Quigley, PJ Brown, E Munch, DH Chitwood (2024) "Allometry and volumes in a nutshell: Analyzing walnut morphology using three-dimensional X-ray computed tomography". <em>The Plant Phenome J</em>.</li> <li><strong>EJA</strong>, F Nasrin, KM Storey, M Yoshizawa (2023) "Genomics data analysis via spectral shape and topology." <em>PLOS One</em></li> <li>SA Cervantes-Pérez <em>et al.</em> (2024) "Tabula Glycine: The whole-soybean single-cell resolution transcriptome atlas." Submitted.</li> <li>Z Ji, <strong>EJA</strong>, L Newton, DH Chitwood, AM Thompson (2024) "From hand measurements to high throughput phenotyping: understanding maize canopy structure and predicting yield." Submitted.</li> </ul> </div> --- background-image: url("../../barley/figs/seed.png") background-size: 325px background-position: 99% 99% class: middle # Roadmap for today 1. Introduction: Addressing the genotype-phenotype gap 1. The shape of spatial patterns of mRNA 1. The shape of the movement of a vampire plant 1. The shape of omics data analysis 1. The shape of things to come 1. Shaping the next generation of interdisciplinary scientists --- class: inverse, middle, center # 1. Introduction ## Shape is data, and data is shape <div class="row"> <div class="column" style="max-width:21%"> <img src="https://botany.one/wp-content/uploads/2018/08/mcy061.jpg"></img> </div> <div class="column" style="max-width:31%"> <img src="../../mcarto/figs/Infected_Cells_01G164600_green_05G092200_yellow.jpg"></img> </div> <div class="column" style="max-width:50%"> <img src="https://i.kinja-img.com/gawker-media/image/upload/s--usj3b0wY--/c_fit,fl_progressive,q_80,w_636/ve69bswtlq7vqih5qrb1.gif"></img> </div> </div> ### Visual intuition ↔ Numbers --- # We use Topological Data Analysis (TDA)!  --- # Phenotyping the shape of things to come <div class="row" style="font-family: 'Yanone Kaffeesatz'; font-size:22px;"> <div class="column" style="max-width:33%"> <p style="line-height:0;text-align: center; font-size:28px">Phenotyping patterns</p> <img style="padding: 0 30px;" src="../figs/molecular_cartography_2x2.jpg"></img> <img style="padding: 0 30px;" src="../figs/persistence_images_1x1.svg"></img> <p style="text-align: center;">mRNA sub-cellular localization in soybean nodule cells.</p> </div> <div class="column" style="max-width:33%"> <p style="line-height:0;font-size:28px;text-align: center;">Phenotyping movement</p> <img style="padding: 0 10px;" src="../../cuscuta/figs/qmlphv.gif"></img> <img style="padding: 35px 30px;" src="../../cuscuta/figs/avg_pl.svg"></img> <p style="text-align: center;">Tracking and describing <i>Cuscuta campestris</i> circumnutation</p> </div> <div class="column" style="max-width:33%"> <p style="line-height:0;font-size:28px;text-align: center;">Phenotyping data</p> <img style="padding: 0 0px;" src="../../nasrin/figs/fpkm_raw_3.png"></img> <img style="padding: 30px 0px;" src="../../nasrin/figs/lung_fpkm_meancorr_eps1.0e+06_r40_g40.png"></img> <p style="text-align: center;">Reducing <strong>and</strong> clustering high-dimensional omics data</p> </div> </div> --- class: inverse, middle, center # 2. Characterizing mRNA spatial patterns and distributions ## with Topological Data Analysis (TDA) ### In collaboration with Marc Libault --- # mRNA localization at a sub-cellular level - Beyond gene expression counts: Spatial segregation and asymmetrical distribution of mRNA across the cytosol in the soybean nodule. - Molecular Cartography™ data provided by the Libault Lab .pull-left[  Infected soybean nodule cells. Glyma.05G092200 in green. Glyma.05G216000 in red. ] .pull-right[ **Goals**: "How patterny is a pattern?" - Quantify the spatial patterns followed by mRNA within individual cells. - Mathematically model all observed mRNA sub-cellular distributions. - *Use this mathematical model to differentiate cell types and genotypes.* **Challenge** - Develop a mathematical model that works for any cell size, orientation, shape, and dimension. ] --- # Traditional model: Density of transcripts   But this characterization discards sub-cellular information! --- # Same density, different patterns  - 97 genes (including 10 bacterial ones) → 2 genes - 2938 cells → 918 infected ones. **Subcellular transcript patterns ↔ spatial location of the cell within the nodule** --- class: inverse, middle, center # Alternate model: Topological Data Analysis  --- # TDA: Keep track of blobs and holes  --- # TDA: Keep track of blobs and holes  --- # TDA: Keep track of blobs and holes  --- # TDA: Keep track of blobs and holes  --- # TDA: Keep track of blobs and holes  --- # TDA: Keep track of blobs and holes  --- # TDA: Keep track of blobs and holes  --- # TDA: Keep track of blobs and holes  --- # TDA: Keep track of blobs and holes  --- # TDA: Keep track of blobs and holes  --- # TDA: Keep track of blobs and holes 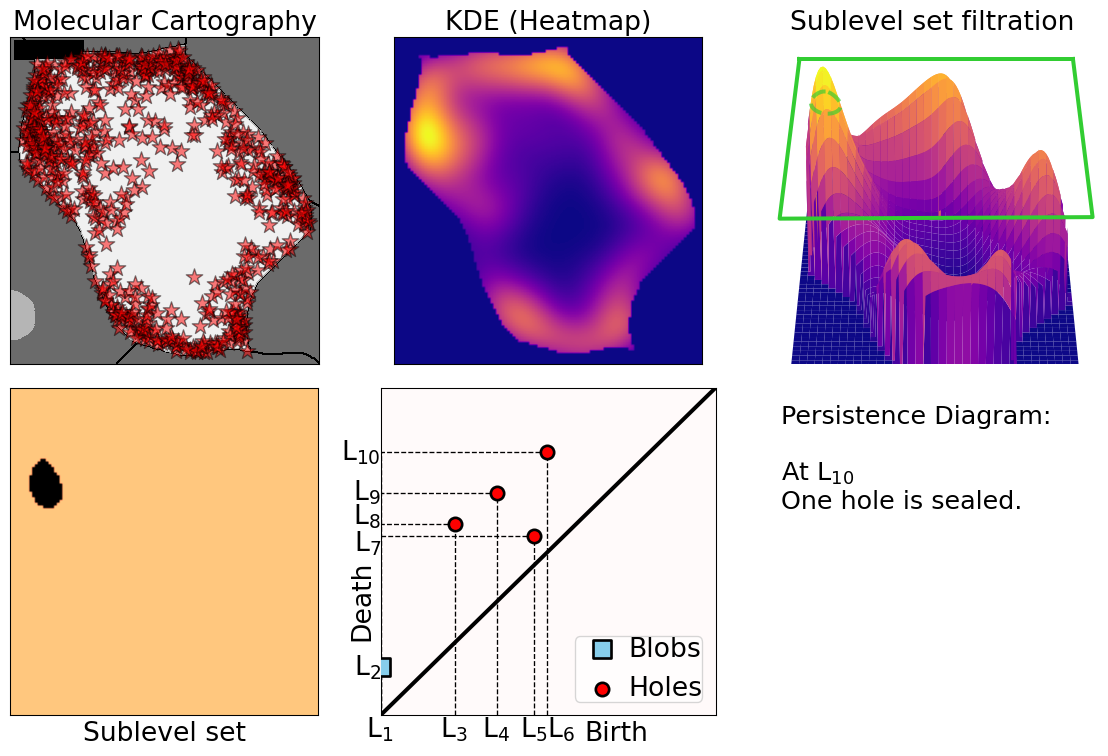 --- # TDA: Keep track of blobs and holes 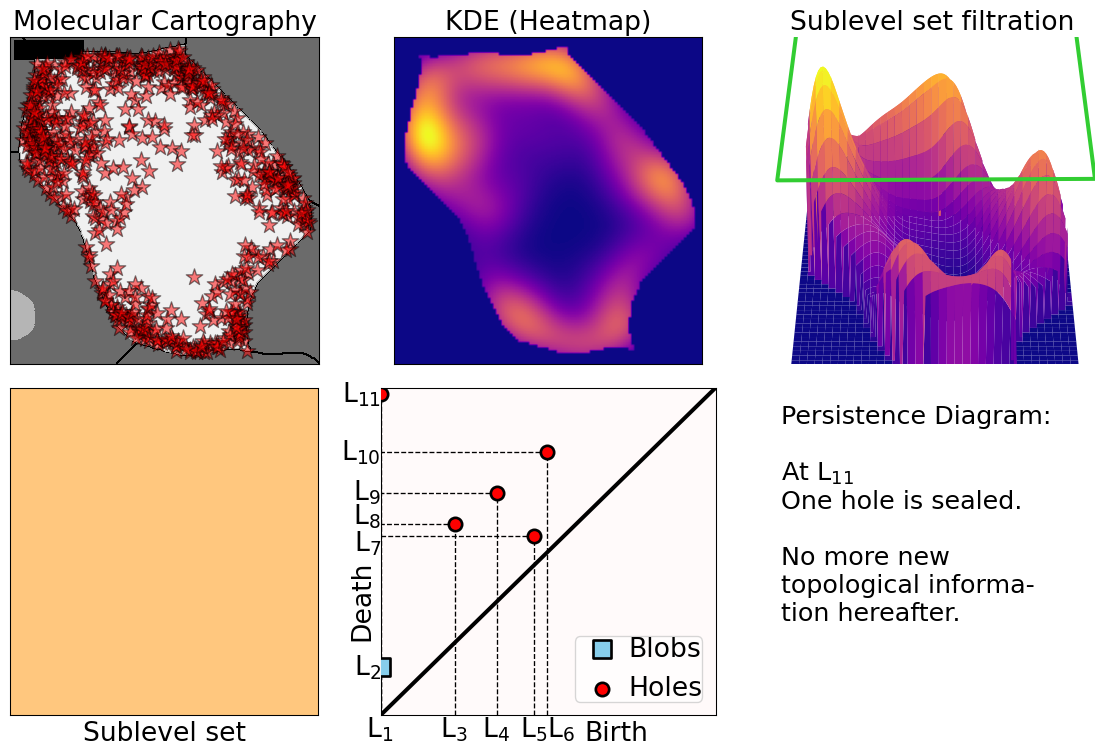 --- # TDA: From patterns to numbers 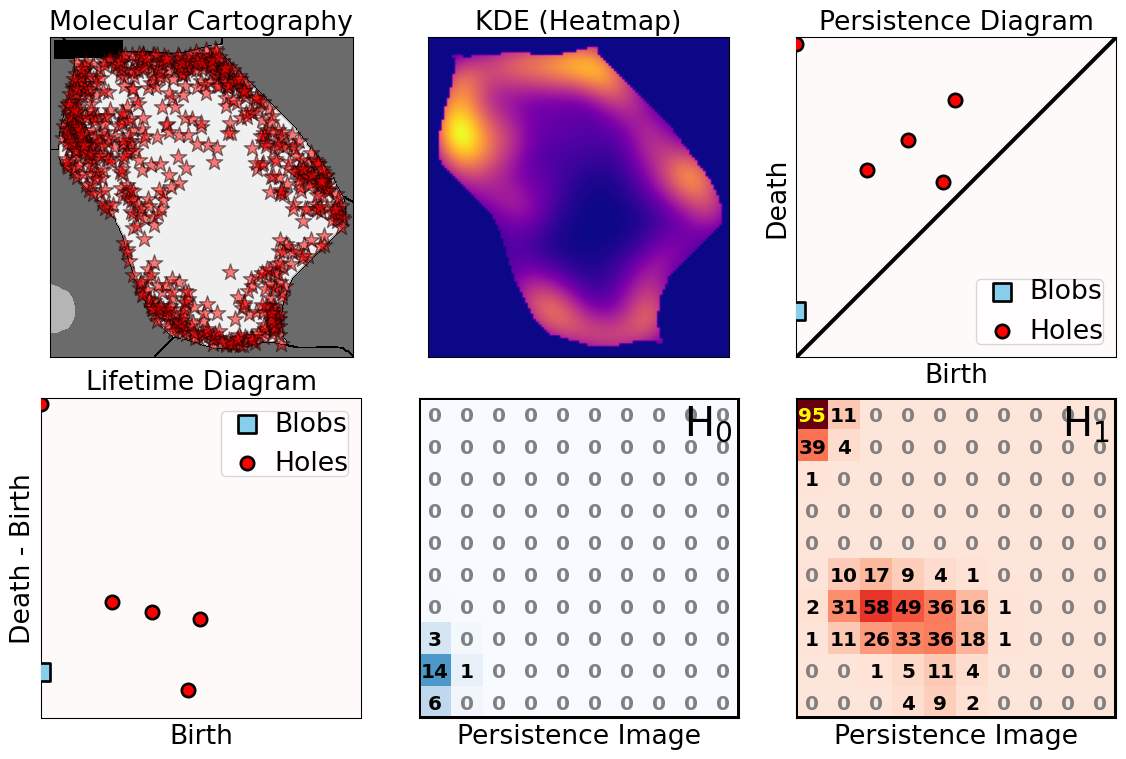 --- # Do TDA for all cell-gene combinations <img src="../figs/molecular_cartography_2x4.png" width="500" style="display: block; margin: auto;" /> <img src="../figs/persistence_images_2x4.png" width="600" style="display: block; margin: auto;" /> --- background-image: url("../figs/bw25_scale32_-_PI_1_1_1_H1+2_cell_sample.png") background-size: 620px background-position: 75% 99% # PCA on all topological descriptors <img src="../figs/bw25_both_scale16_-_PI_1_1_1_pca_H1+2_gridded.png" width="350" style="display: block; margin: auto auto auto 0;" /> --- background-image: url("../figs/bw25_scale32_-_PI_1_1_1_H1+2_kde_sample.png") background-size: 620px background-position: 75% 99% # Show me <img src="../figs/bw25_both_scale16_-_PI_1_1_1_pca_H1+2_gridded.png" width="350" style="display: block; margin: auto auto auto 0;" /> --- # Connecting PC 02 to the biological context 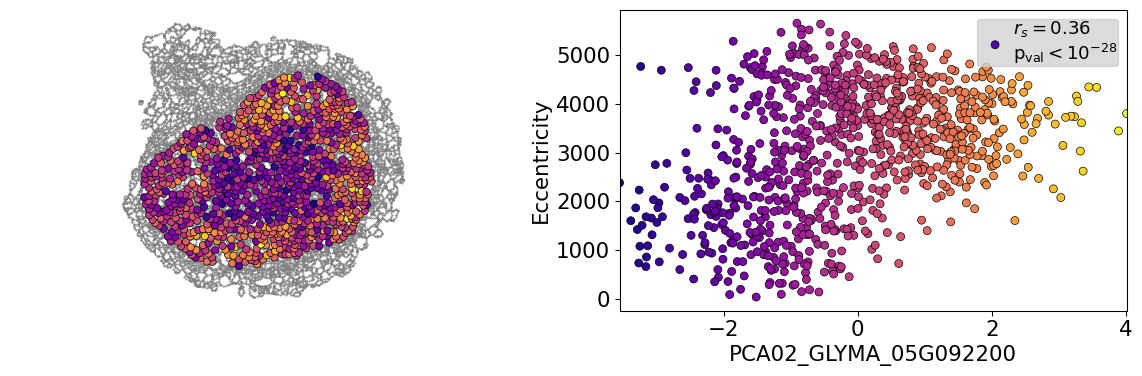  - Senescent cells exhibit a distinct transcriptomic spatial pattern compared to the rest of population. - Loss of mRNA localization may be a lesser known contributor to cell senescence. --- # We define a morphospace of transcriptomic patterns  # We then work "backward" --- class: bottom background-image: url("../figs/scale32_-_PI_1_1_1_H1+2_synthetic_30_clusters.jpg") background-size: 900px background-position: 50% 1% <img src="../figs/scale32_-_PI_1_1_1_H1+2_synthetic_pca_30_clusters.jpg" width="600" style="display: block; margin: auto;" /> --- class: bottom background-image: url("../figs/scale32_-_PI_1_1_1_H1+2_synthetic_varclusters.jpg") background-size: 900px background-position: 50% 1% <img src="../figs/scale32_-_PI_1_1_1_H1+2_synthetic_pca_varclusters.jpg" width="600" style="display: block; margin: auto;" /> --- # Discussion and future directions **Biologically speaking** - Senescent cells exhibit a distinct transcriptomic spatial pattern compared to the rest of population. - Loss of mRNA localization may be a lesser known contributor to cell senescence. - *How does the morphospace of patterns change if we take into account more genes, more cell types, more tissues, and more mutants?* **Mathematically speaking** - Topological Data Analysis offers a robust way to encode the shape of patterns. - Robust to differences in scale, underlying boundaries, or orientation. - The framework is open to any number of cells, genes, and dimensions. <img src="../figs/D2_GLYMA_05G092200_z_kde_pd_suplevel_by_both_00512.jpg" width="550" style="display: block; margin: auto;" /> --- class: center, inverse, middle # 3. Tracking how a vampire plant wiggles <img src="../../cuscuta/figs/bentelspacher_etal2024.png" width="600" style="display: block; margin: auto;" /> ### In collaboration with Soyon Park --- background-image: url("../../cuscuta/figs/cuscuta_overview_vogel_etal_2018.webp") background-size: 350px background-position: 15% 90% # _Cuscuta campestris_ : a vegetarian plant .pull-right[ **Goal**: "How wiggly is a wiggle?" - Mathematically model how _Cuscuta_ moves under various environmental conditions to ultimately stop it from attaching to crops in the first place. **Challenges** - Develop an image-based high-throughput phenotyping algorithm that tracks *Cuscuta* as it coils. - Develop a mathematical framework that works for any locomotion: circumnutation, twitching, idling, etc. <p style="font-size: 10px; text-align: left; color: Grey;">Image Credits: <a href="https://doi.org/10.1038/s41467-018-04344-z">Vogel <em>et al.<em> (2018)</a></p> ] --- # Snapshots taken every 96 secs for 24h <video width="900" controls> <source src="../../cuscuta/video/9am_Inc_Rep_3_redone.mp4" type="video/mp4"> </video> - Inoculation at 9am, 12pm, and 4pm - Experiment setup and data provided by the Park Lab --- # Putting it all together <video width="900" controls> <source src="../../cuscuta/video/4pm_rep7_plant_01.mp4" type="video/mp4"> </video> --- # Automated phenotyping <img src="../../cuscuta/figs/4pm_rep7_plant_02_posang.png" width="700px" style="display: block; margin: auto;" /><img src="../../cuscuta/figs/cuscuta_tracking.png" width="700px" style="display: block; margin: auto;" /> --- # Discussion  **Biologically speaking** - Cuscuta can tell time despite lacking photoreceptors. - It prefers to act in the morning/early afternoon. - *How does the wiggle vary under other environmental conditions?* **Computationally speaking** - Overall, the automated image analysis criteria agreed with the main conclusions drawn from the manual observation criteria. - Our pipeline is ready to collect more data --- background-image: url("../../cuscuta/figs/cuscuta_coords.jpg") background-size: 450px background-position: 95% 25% # Future wiggle room .pull-left[ **Grant re-submitted to NSF eMB (Emerging Mathematics in Biology) on March 2025** - Cuscuta locomotion is affected by Volatile Organic Compounds (VOCs). - Transform a Cuscuta position into a vector of angles. - Use TDA to characterize all the vectors of all the positions. ]  --- class: center, middle inverse # 4. Phenotyping data itself ## Omics data analysis with topology <img src="../../nasrin/figs/amezquita_etal_2023.png" width="750" style="display: block; margin: auto;" /> --- background-image: url("../../nasrin/figs/mapper_vs_tsne_half.png") background-size: 450px background-position: 10% 90% # Setup - FPKM counts of RNAseq data from human lung tissue → 19,648 genes - 314 healthy samples (GTEx) - 500 cancerous samples (TCGA) - tSNE (or UMAP) separates healthy vs cancerous samples (blue vs red) .pull-right[ **Question**: "Is the RNAseq data arranged into a specific shape?" - Are there subgroups that we are ignoring? - Can we go from clusters to continua? - What is the biological characterization of such continua? ] --- background-image: url("../../tda/figs/mapper_b_00.svg") background-size: 725px background-position: 50% 95% # Mapper ## Topological summary: exploration and visualization - We start with **lots** of data points in a **high-dimensional** space. - We want just a **handful** of points in a **low-dimensional** space that roughly preserve the original **shape**. --- background-image: url("../../tda/figs/mapper_c_complete.svg") background-size: 525px background-position: 50% 99% # Mapper in a single picture --- # Mapper and lung cancer data .pull-left[   ] .pull-right[ - Mapper produced mostly strand-like graphs regardless of parameters used - Healthy subjects tend to stay at the center - Cancerous samples are distributed at both ends - Healthy subjects that land in between might be at risk - **Predictive model**: Take a new patient sample and you can assess its cancer risk based on where they land in this continuum. ] --- # Biological significance  --- # Discussion and future directions .pull-left[ - Data visualization to inspire new research. - Mapper finds novel sub-clusters that reveal important nuances. - Agnostic to any kind of -omics data - Mapper remains underused and there is plenty of untapped potential in plant genomics  ] .pull-right[   ] --- class: inverse, center, middle # 5. The shape of things to come ## New research frontiers at the intersection of math, data science, and plant biology ### Phenotyping at all scales <img src="https://bondlsc.missouri.edu/wp-content/uploads/2015/02/sanborn-620x413.jpg" width="400" style="display: block; margin: auto;" /> --- background-image: url("../../tutorials/figs/mizzou_math_drp.png") background-size: 250px background-position: 99% 1% # Complex network analysis .pull-left[ Further analysis of Mapper, gene coexpression, and microbiota interaction networks, and beyond.  <p style="font-size: 10px; text-align: left; color: Grey;">Credits: <a href="https://doi.org/10.1128/msystems.01570-24">Jiang <em>et al.</em>(2024)</a></p> ] .pull-right[ Or even analysis on the collaboration within the IPG <img src="../../tutorials/figs/ipg_network.jpg" width="300" style="display: block; margin: auto;" /> ] Math students: Ethan Lenhardt, Sophia Knehans, Roberto Herrera --- background-image: url("../../tutorials/figs/mizzou_math_drp.png") background-size: 250px background-position: 99% 1% # Spatial topological data analysis .pull-left[ <img src="../../tda/figs/025-imperial.png" width="200" style="display: block; margin: auto;" /><img src="../../tda/figs/107-tulare.png" width="200" style="display: block; margin: auto;" /> <img src="https://www.researchgate.net/publication/362833654/figure/fig2/AS:11431281098979080@1669173266225/Two-persistence-diagrams-for-the-simulation-shown-in-Fig-1-The-blue-crosses-represent.png" width="200" style="display: block; margin: auto;" /> <p style="font-size: 10px; text-align: center; color: Grey;">Credits: <a href="https://doi.org/10.1137/19M1241519">Feng and Porter (2021)</a></p> ] .pull-right[ Use TDA to analyze geographical patterns across the state.  Use TDA to analyze spatial patterns patterns: if you squint enough, a voting district looks pretty much like a plant cell. <img src="../../psd/figs/pavement_plasma.jpg" width="200" style="display: block; margin: auto;" /> ] Math students: Jake Parmentier and Thomas Searcy --- background-image: url("../../tutorials/figs/mizzou_math_drp.png") background-size: 250px background-position: 99% 1% # Phenotype everywhere! .pull-left[    Image automation (w/ David Mendoza) ] .pull-right[ <img src="../../psd/figs/MAX_Composite-1.jpg" width="250" style="display: block; margin: auto;" /> Spatial transcriptomics (w/ Jie Zhu) <img src="../../root_necrosis/figs/geodesic_comparison_-_222M_side1_030117006.png" width="250" style="display: block; margin: auto;" /> 2D root image analysis (w/ Miranda Haus (MSU)) ] --- background-image: url("https://plantsandpython.github.io/PlantsAndPython/_images/plants_python_logo.jpg") background-size: 180px background-position: 99% 1% class: inverse, center, middle # 6. Shaping the next generation of interdisciplinary scientists ## Large amounts of data require large amounts of people ## PLNT_SCI 2500: Data Science for Life Sciences I  --- ## PLNT_SCI 2500: Python taught for life sciences <p align="center"> <iframe width="800" height="550" src="../../tutorials/plnt_2500/Day-10_In-Class_NumPyDataAnalysis2-INSTRUCTOR.html" title="Day10"> </iframe> </p> --- ## PLNT_SCI 2500: With data from DPST faculty! <p align="center"> <iframe width="800" height="550" src="../../tutorials/plnt_2500/Day-13_In-Class_Regression-INSTRUCTOR.html" title="Day10"> </iframe> </p> --- ## PLNT_SCI 2500: Active learning, example driven <p align="center"> <iframe width="800" height="550" src="../../tutorials/plnt_2500/Day-20_In-Class_AdvancedPlotting-INSTRUCTOR.html" title="Day10"> </iframe> </p> --- background-image: url("https://www.biorxiv.org/content/biorxiv/early/2022/09/09/2022.09.07.506951/F1.large.jpg?width=800&height=600&carousel=1") background-size: 325px background-position: 1% 60% # Discussion and future goals **PLNT_SCI 2500: Data Science for Life Sciences I will be the first course for the emerging Data Science for Life Sciences Certificate** .right-column[ - Incorporate examples from outside Plant Science to appeal to more students - Data Science for Life Sciences II will build on top more Data Science topics: - Supervised and unsupervised classification - Clustering algorithms - Non-linear regressions - Network analyses - Statistical paradoxes to be wary of **Personal Goal: Make the teaching of data science in life sciences a scientific endeavor in itself** - Collaborate with colleagues from the College of Education. - Motivate students to tackle a single research problem as a unit. ] --- background-image: url("https://upload.wikimedia.org/wikipedia/commons/4/4a/University_of_Missouri_logo.svg") background-size: 60px background-position: 99% 1% class: inverse ## Thank you! .pull-left[ **mRNA sub-cellular localization** - Sutton Tennant - Sandra Thibivillers - Sai Subhash - Benjamin Smith - Samik Bhattacharya - Jasper Kläver - Marc Libault **Cuscuta circadian rhythm and locomotion** - Max Bentelspacher - Supral Adhikari - Jaime Barros-Rios - Joseph Lynch - So-Yon Park **Mapper for omics analysis** - Farzana Nasrain - Katie Storey - Masato Yoshizawa ] .pull-right[ **Collaboration of the IPG network** - Ethan Lenhardt - Sophia Knehans - Roberto Herrera - David Braun **Data Science for Life Sciences I** - Kent Shannon - Andrew Scaboo - Jianfeng Zhou - Debbie Finke **Other ongoing projects** - Leyre Urmeneta - Laura Martins - Mather Khan - David Mendoza-Cozatl - Miranda Haus - Jie Zhu **More details** <p style="font-size: 20px; text-align: center; color: Blue;">ejamezquita.github.io/</p> <p style="font-size: 20px; text-align: center; color: Blue;">eah4d@missouri.edu</p> ]