class: center, middle, inverse, title-slide .title[ # The mathematical shape of plants ] .subtitle[ ## Topological Data Analysis and plant science ] .author[ ### Erik Amézquita<br>—<br>Division of Plant Science & Technology<br>Department of Mathematics<br>University of Missouri<br>— ] .date[ ### 2026-04-07 ] --- background-image: url("../../demat/figs/fam9_3.png") background-size: 100px background-position: 98% 2% # About me: From MX to MI to MO at MU ## I work across multiple disciplines and countries .left-column[  ] .right-column[ - 2013 - 2018 : Licenciatura (Bachelor): Mathematics @ Universidad de Guanajuato and CIMAT. - 2018 - 2023 : PhD: Computational Mathematics, Science & Engineering @ Michigan State University - 2023 - 2025 : ~~PFFFD~~ ~~PFFIE~~ PFF Postdoctoral Fellow: Plant Science / Mathematics @ University of Missouri (MU). - 2025 - present: Assistant Professor: Plant Science / Math @ MU. ] # Quantifying the intuition Intuifying the quantities --- # Come for the math, stay for the plants <div class="row" style="font-family: 'Yanone Kaffeesatz'; font-size:22px;"> <div class="column" style="max-width:33%"> <p style="line-height:0;text-align: center; font-size:28px">The shape of adaptability</p> <img style="padding: 0 70px;" src="../../barley/figs/S017_L3_1.gif"></img> <img style="padding: 0 55px;" src="../../barley/figs/ecc_X.gif"></img> <p style="text-align: center;">Topological Data Analysis</p> <p style="text-align: center;">Euler Characteristic Transform</p> </div> <div class="column" style="max-width:33%"> <p style="line-height:0;font-size:28px;text-align: center;">The shape of development</p> <img style="padding: 0 60px;" src="../../citrus/figs/SR01_L01_black_exocarp.gif"></img> <img style="padding: 0 27px;" src="../../citrus/figs/SW03_CRC1241-B_12B-4-3_L00_lambproj_v.jpg"></img> <p style="text-align: center;">Ellipsoidal modeling</p> <p style="text-align: center;">Directional statistics</p> </div> <div class="column" style="max-width:33%"> <p style="line-height:0;font-size:28px;text-align: center;">The shape of domestication</p> <img style="padding: 0 35px;" src="../../walnuts/figs/2014SBa_R5_T81_meat_2.gif"></img> <img style="padding: 0 10px;" src="../../walnuts/figs/kernel_volume_vs_nut_volume.png"></img> <p style="text-align: center;">Allometry of multiple tissues</p> <p style="text-align: center;">Convexity indices</p> </div> </div> --- # Phenotyping the shape of things to come <div class="row" style="font-family: 'Yanone Kaffeesatz'; font-size:22px;"> <div class="column" style="max-width:33%"> <p style="line-height:0;text-align: center; font-size:28px"><mark>Phenotyping patterns</mark></p> <img style="padding: 0 30px;" src="../../mcarto/figs/molecular_cartography_2x2.jpg"></img> <img style="padding: 0 30px;" src="../../mcarto/figs/persistence_images_1x1.svg"></img> <p style="text-align: center;">mRNA sub-cellular localization in soybean nodule cells.</p> </div> <div class="column" style="max-width:33%"> <p style="line-height:0;font-size:28px;text-align: center;">Phenotyping movement</p> <img style="padding: 0 10px;" src="../../cuscuta/figs/qmlphv.gif"></img> <img style="padding: 35px 30px;" src="../../cuscuta/figs/avg_pl.svg"></img> <p style="text-align: center;">Tracking and describing <i>Cuscuta campestris</i> circumnutation</p> </div> <div class="column" style="max-width:33%"> <p style="line-height:0;font-size:28px;text-align: center;"><mark>Phenotyping data</mark></p> <img style="padding: 0 0px;" src="../../nasrin/figs/fpkm_raw_3.png"></img> <img style="padding: 30px 0px;" src="../../nasrin/figs/lung_fpkm_meancorr_eps1.0e+06_r40_g40.png"></img> <p style="text-align: center;">Reducing <strong>and</strong> clustering high-dimensional omics data</p> </div> </div> --- class: inverse, middle, center # Phenotyping patterns ## How *pattern-y* is a pattern? <img src="../../mcarto/figs/sutton_etal_2025.png" alt="" width="650" style="display: block; margin: auto;" /> --- # mRNA localization at a sub-cellular level - **Beyond gene expression counts**: Spatial segregation and asymmetrical distribution of mRNA across the cytosol in the soybean nodule. - Molecular Cartography™ data provided by the Libault Lab .pull-left[  Infected soybean nodule cells. Glyma.05G092200 in green. Glyma.05G216000 in red. ] .pull-right[ **Goals**: "How patterny is a pattern?" - Quantify the spatial patterns followed by mRNA within individual cells. - Mathematically model all observed mRNA sub-cellular distributions. - *Use this mathematical model to differentiate cell types and genotypes.* **Challenge** - Develop a mathematical model that works for any cell size, orientation, shape, and dimension. ] --- # Same expression levels, different patterns  **Subcellular transcript patterns ↔ spatial location of the cell within the nodule** --- background-image: url("../../mcarto/figs/GLYMA_05G092200_TDA_c00282_122.png") background-size: 800px background-position: 50% 85% # KDEs ⊕ Sublevel sets ⊕ Pers. images --- background-image: url("../../mcarto/figs/bw25_scale32_-_PI_1_1_1_H1+2_cell_sample.png") background-size: 620px background-position: 75% 99% # PCA on all topological descriptors <img src="../../mcarto/figs/bw25_both_scale16_-_PI_1_1_1_pca_H1+2_gridded.png" alt="" width="350" style="display: block; margin: auto auto auto 0;" /> --- background-image: url("../../mcarto/figs/bw25_scale32_-_PI_1_1_1_H1+2_kde_sample.png") background-size: 620px background-position: 99% 50% .left-column[ # PC 1 - Related to the number of distinct hotspots - Correlated to transcript number and cell size # PC 2 - Related to the heterogeneity of hotspots - Correlated to transcript density ] --- # Connecting PC 02 to the biological context  - Senescent cells exhibit a distinct transcriptomic spatial pattern compared to the rest of population. - Loss of mRNA localization may be a lesser known contributor to cell senescence. --- # We define a morphospace of transcriptomic patterns  # We then work "backward" --- class: bottom background-image: url("../../mcarto/figs/scale32_-_PI_1_1_1_H1+2_synthetic_varclusters.jpg") background-size: 900px background-position: 50% 1% <img src="../../mcarto/figs/scale32_-_PI_1_1_1_H1+2_synthetic_pca_varclusters.jpg" alt="" width="600" style="display: block; margin: auto;" /> --- # Gerrymandering tears and battlefields .pull-left[ <img src="../../tda/figs/025-imperial.png" alt="" width="220" style="display: block; margin: auto;" /><img src="../../tda/figs/107-tulare.png" alt="" width="220" style="display: block; margin: auto;" /><img src="../../psd/figs/pavement_plasma.jpg" alt="" width="220" style="display: block; margin: auto;" /> (w/Colin Nichols and Tyler Mitts) ] .pull-right[   Spatial transcriptomics of a battlefield ] --- class: inverse, middle, center # Phenotyping data ## The shape of omics data and molecular biology <img src="../../nasrin/figs/amezquita_etal_2023.png" alt="" width="750" style="display: block; margin: auto;" /> --- background-image: url("../../nasrin/figs/mapper_vs_tsne_half.png") background-size: 450px background-position: 10% 90% # Problem: Data is very high-dimensional - FPKM counts of RNAseq data from human lung tissue → 19,648 genes - 314 healthy samples (GTEx) - 500 cancerous samples (TCGA) - tSNE (or UMAP) separates healthy vs cancerous samples (blue vs red) .pull-right[ **Question**: "Is the RNAseq data arranged into a specific shape?" - Are there subgroups that we are ignoring? - Can we go from clusters to continua? - What is the biological characterization of such continua? ] --- background-image: url("../../tda/figs/mapper_b_00.svg") background-size: 725px background-position: 50% 95% # Mapper ## Topological summary: exploration and visualization - We start with **lots** of data points in a **high-dimensional** space. - We want just a **handful** of points in a **low-dimensional** space that roughly preserve the original **shape**. --- background-image: url("../../tda/figs/mapper_c_complete.svg") background-size: 525px background-position: 50% 99% # Mapper in a single picture --- # Mapper and lung cancer data .pull-left[   ] .pull-right[ - Mapper produced mostly strand-like graphs regardless of parameters used - Healthy subjects tend to stay at the center - Cancerous samples are distributed at both ends - Healthy subjects that land in between might be at risk - **Predictive model**: Take a new patient sample and you can assess its cancer risk based on where they land in this continuum. ] --- # Biological significance  --- background-image: url("../../nasrin/figs/rice_mapper_2025-11-20.png") background-size: 905px background-position: 50% 90% # Leading the Resistance with mapper - RNASeq data from rice samples: control and bacterial infection - w/ Olivia Fisk and Gloria Asare --- class: inverse, center, middle # Other related research interests .pull-left[  **Studying the people that study plants** w/ Sophia Knehans and Roberto Herrera ] .pull-right[ **The landscape of data science education in biology programs** 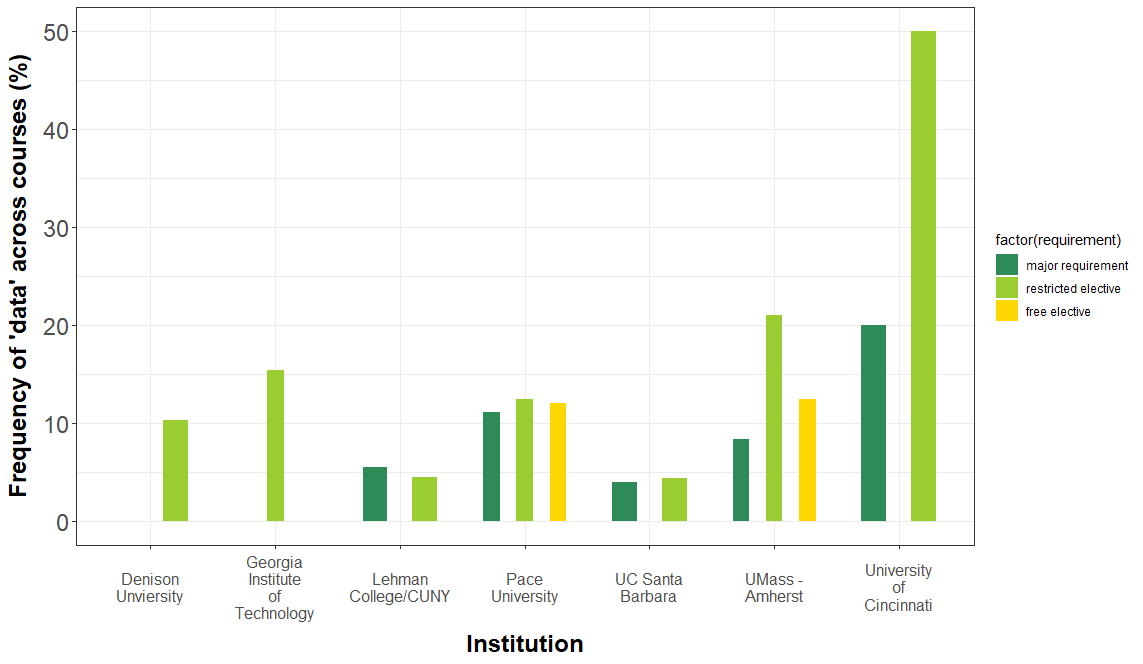 ] --- background-image: url("https://upload.wikimedia.org/wikipedia/commons/4/4a/University_of_Missouri_logo.svg") background-size: 60px background-position: 99% 1% class: inverse ## Thank you! .pull-left[ **Barley seeds ⊕ ECT** - Liz Munch - Dan Chitwood - Michelle Quigley - Tim Ophelders - Jacob Landis - Dan Koenig **mRNA sub-cellular localization** - Sutton Tennant - Sandra Thibivillers - Sai Subhash - Benjamin Smith - Samik Bhattacharya - Jasper Kläver - Marc Libault **Mapper for lung cancer** - Farzana Nasrain - Katie Storey - Masato Yoshizawa ] .pull-right[ **Collaboration of the IPG network** - Ethan Lenhardt - Sophia Knehans - Roberto Herrera - David Braun **Other ongoing TDA projects** - Laura Martins - Mather Khan - David Mendoza-Cozatl - Jie Zhu - Felix Fritschi - Jose Costa Netto - Tim Duff - Olivia Fisk - Gloria Asare - Ajay Gupta - Bing Yang - Tyler Mitts - Colin Nichols **More details** <p style="font-size: 20px; text-align: center; color: Blue;">ejamezquita.github.io/</p> <p style="font-size: 20px; text-align: center; color: Blue;">eah4d@missouri.edu</p> ]