✅ Put your name here
Using online resources (code and data) and analyzing and visualizing data
Google used to be much better back in the day. Credits: PHD Comics
Learning goals for today’s assignment
Compare and evaluate datasets
Make visualizations using tools that you found online
Present a dataset using visualizations
Assignment instructions
Work with your group to complete this assignment. Instructions for submitting this assignment are at the end of the Notebook. The assignment is due at the end of class.
Introduction
The goal of this assignment is for you and your group to make one or more visualizations of real-world data and then share these visualizations with the rest of the class. This is meant to be a kind of test run of the skills you'll be expected to demonstrate for the semester project.
In the pre-class assignment, you were tasked with finding a dataset and a new plotting tool using online resources. In today's assignment, you will be:
Sharing the datasets and plotting tools you found in the pre-class assignment with your group.
Picking (as a group) one dataset to work with
Using one or more of the plotting tools to make one or more visualizations of the data
Sharing the visualization(s) that you made with the rest of the class
1. Sharing out with your group
✅ Task
As a group, take turns sharing your datasets and plotting tools with one another.
✎ Use this space to take notes on what your group mates shared
2. Picking one dataset to work with
✅ Task
As a group, pick one of the datasets to work with. When deciding on which dataset to use, keep in mind that you will need to use it to make one or more visualizations. If two datasets are equally popular, feel free to split your group in half and work on both dataset (this is only permitted if your group has 4 or more people, there should be a minimum of two people working on each dataset).
3. Create one or more visualizations of your dataset
✅ Task
As a group, create one or more visualizations of this dataset. Remember that you are allowed to use AI-generated code as long as you (a) disclose its usage; (b) demonstrate you understand the code; and (c) take responsibility for any mistakes in it. Do not use AI to craft the actual story behind your data and your plot.
Example
Below are two example plots, which have been created using the data retrived in the example in the pre-class assignment (i.e., Cocoa Export data taken from the FAO). When presenting plots of this dataset, it might make sense to use the linear plot to note how much of the total exports are coming from just a small handful of countries—most of which are on Africa’s west coast—and put special empahsis on the dominant role played by the Cote d’Ivoire (Ivory Coast). As a second plot, it would be reasonable use the log plot to talk about how there are still many countries that have some Cocoa bean exports, just significantly less than the top few countries.
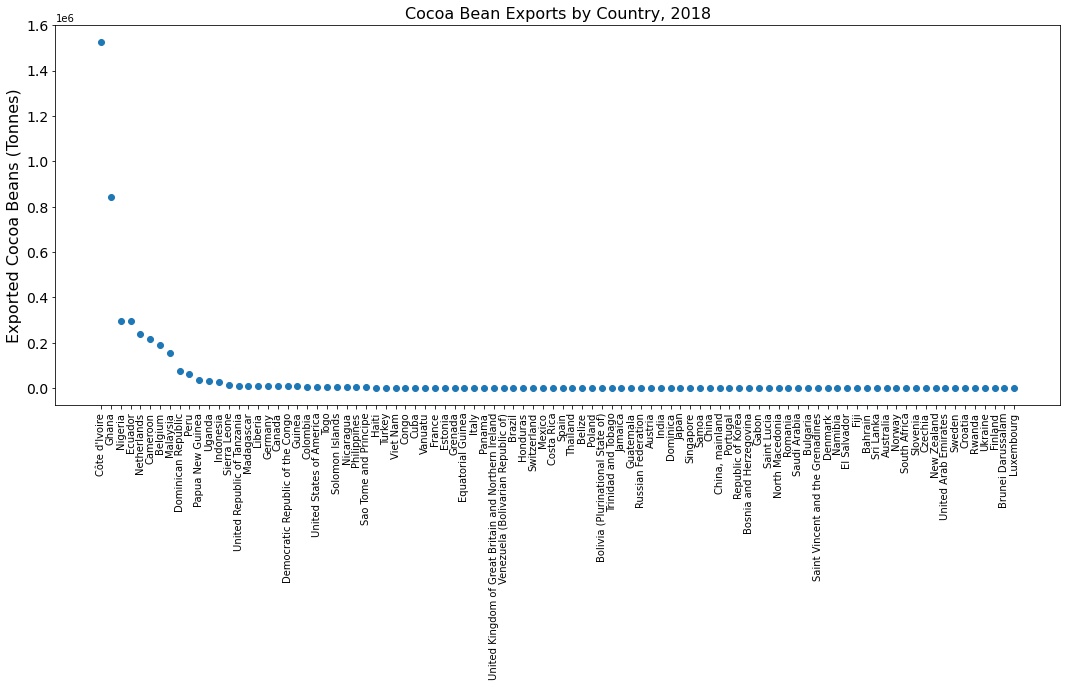
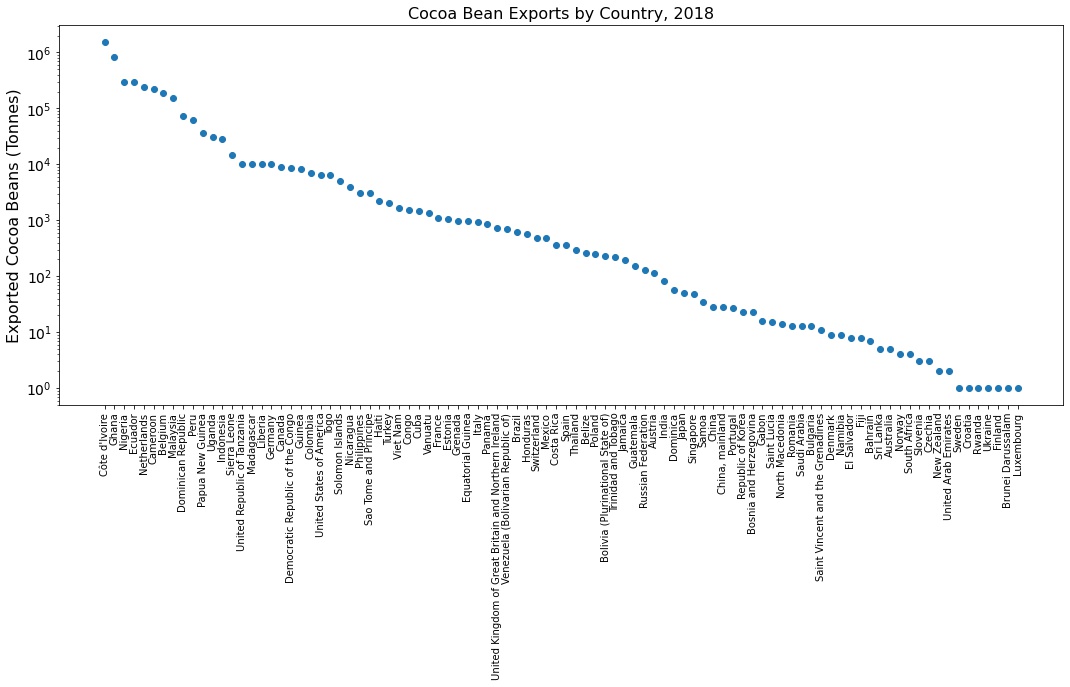
Of course, there are other ways that one could visualize this data! Also, additional effort could have been made to make these plots easier to read, given more time. As you work on your plots, once you get the basic plot made, considering how you could improve the aesthetics and readability of your plots.
# Write the code for your visualizations here
# Every member of your group should have a copy of this code in their final notebooks.
4. Present your visualizations to the rest of the class: Tell us a story!
✅ Task
As a group—just like in the last in-class—you will present your visualizations to the rest of the class to tell the rest of the class about the specific dataset that you've chosen to work with. Your instructor should have shared a link for your group to drop your visualizations. Put your visualizations on your slide, and decide how you are going to present them to the rest of the class. You can create one additional slide for your group if needed.
Remember: data science at its core is storytelling. Have AI do the code if you wish (responsibly of course), but us humans have to always do the story!
Congratulations, you’re done!
Submit this assignment by uploading it to the course Canvas web page. Go to the “In-class assignments” folder, find the appropriate submission link, and upload it there.
See you next class!
Material drawn with permission from:
© Copyright 2025. Department of Computational Mathematics, Science and Engineering—Michigan State University
Adapted for:
© Copyright 2026, Division of Plant Science & Technology—University of Missouri