✅ Put your name here
Using Python and Jupyter Notebooks to plan your next visit to the Gateway Arch National Park

Credits: National Park Service
Learning goals for today’s in-class assignment
Make sure you have correctly installed Python and Jupyter notebooks via miniconda
Check that you can run your first Python code
Extract trend informations from data visualization
⚠️ To keep your files organized, make a new folder for this course. Do not keep all your files jumbled in the Downloads folder.
Make a dedicated folder, where you’ll keep all the Jupyter Notebooks and associated data sets
1. Introduction to Jupyter Notebooks
If you’re reading this right now, it means you’ve already managed to get most of it working! We’ll be working through how to download, run, save, and upload Jupyer Notebooks in class.
If you want to start using keyboard shortcuts in Jupyter Notebooks to make your life easier and more efficient, try pressing ESC to enter command mode and then press Ctrl + Shift + H. This will bring up the list of the keyboard shortcuts. Make note of these. As we move through the semester, you’ll get used more and more these shortcuts.
The most important one (IMO): To make notebook cells that have Python code in them do something, hold down the
Shiftkey and then press theEnterkey.Alternatively, you can click the play button ▶ on the top menu.
Another useful shortcut is
Bto insert a blank cell below.
Remember to press Esc before trying any shortcut
✅ Task 1: Your first Jupyter navigation
Press
Escand thenBto create and insert a new cell below.Press
Escand thenMto make this cell Markdown mode (not code).In the new cell, write a short sentence on what you did last Winter Break.
To display the cell as normal text, press either
Ctrl+EnterorShift+Enter.
✅ Task 2: Your first Hello World!
Create and insert a new cell below
In the new cell, type
print('Hello World!')To run this code, again press either
Ctrl+EnterorShift+Enter.
We will learn much more Python throughout the sessions.
✅ Task 3: Edit an existing cell
Edit this cell by double clicking on it, or alternatively, click on it once and then press
EnterThen complete the sentence below:
For this course, I am looking forward to:
2. Introduction to Data Viz with Python
Computer-based visualization is widely used in biology to help understand and communicate data, to generate ideas and to gain insight into biological processes: Genomes, sequence alignments, phylogenies, macromolecular structures, systems biology data, and image-based data (O’Donoghue et al 2010).
Data visualization (data viz for short) is not limited to biology. Data viz can help us in general to:
Simplify complexity
Enhance decision-making
Improve communication
Reveal hidden insights
Engage and persuade
For this assignment, we will use Python and Data Viz to figure out which month would be the best month to visit the Gateway Arch National Park in St. Louis. The monthly visitor data was obtained from the National Park Service statistics.
Make sure you have downloaded the CSV file that came with this lesson.
# Just press Shift + Enter to run this cell
# Or click on the "Play/Run" button on the top menu

# Import libraries

import pandas as pd
import numpy as np
import matplotlib as mpl
import matplotlib.pyplot as plt
# Just press Shift + Enter to run this cell
# Or click on the "Play/Run" button on the top menu
# Load and display the data
filename = 'Recreation Visitors By Month Gateway Arch NP.csv'
visits = pd.read_csv(filename, index_col=0)
visits✅ Task 4: Data interpretation I
Looking just at the table of numbers, can you quickly tell the following (do not spend more than 5 mins here; move on regardless of your progress):
What is the month with the most visitors?
How big is the gap between the most visited month vs the second most visited month?
Do all years follow the same trend?
Is there a year that looks very different than the rest?
Say you and your family want to visit the Gateway Arch National Park. Assuming that everybody can take time off anytime, what month would you suggest to go?
(Click on this cell and then press Enter to edit it)
✎ Your answers
🛑 STOP: Do not run the cell below just yet until you’ve finished Task 4
Now visualize the data
Let’s now try to answer the same questions, but instead of looking purely at numbers, let’s look at a plot based on these numbers.
# Just press Shift + Enter to run this cell
# Or click on the "Play/Run" button on the top menu

# Set up plot details

font_size = 12
color_list = ['lightgray', 'seagreen', 'indianred', 'tab:blue', 'palevioletred', 'gold', 'orange', 'gray', 'deepskyblue']
marker_list = ['o', 'D', 'P', '<', 'v', '>', '^', 's', 'X', 'h']
xaxis = list(range(visits.shape[1]))

# Making the plot pretty
fig, ax = plt.subplots(1, 1, figsize=(10,5), sharex=True)
ax.set_ylabel('No. of visitors', fontsize=font_size)
ax.set_title('Gateway Arch National Park', fontsize=font_size)
ax.set_facecolor('snow')
ax.tick_params(labelsize=font_size)
ax.set_xticks(xaxis, visits.columns)

# The actual data is plotted
for i in range(len(visits)):
    ax.plot(xaxis, visits.iloc[i], color=color_list[i], marker=marker_list[i], mec='k', ms=10, label=visits.index[i])
ax.legend(loc='upper right', fontsize=font_size, title='Year', title_fontsize='large', framealpha=1, facecolor='whitesmoke');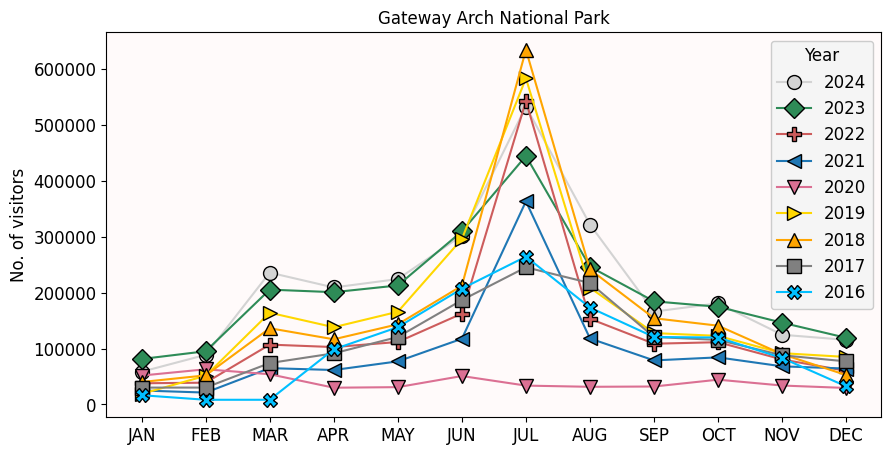
✅ Task 5: Data interpretation II
What is the month with the most visitors? Do you find it surprising or does it check out your intuition/experience? Explain.
How big is the gap between the most visited month vs the second most visited month?
Do all years follow the same trend? Is there a year that looks very different than the rest? If so, do you find it surprising or does it check out your intuition/experience? Explain.
Say you and your family want to visit the Gateway Arch National Park. Assuming that everybody can take time off anytime, what month would you suggest to go?
(Click on this cell and then press Enter to edit it)
✎ From the graph I above I see that..
✅ Task 6: Compare and contrast
Compare your experience between Task 4 and Task 5.
Which Task did you find easier?
Was there something that you noticed from the plot that you would have missed just looking at numbers?
(Click on this cell and then press Enter to edit it)
✎ Your answer
Congratulations, you’re done!
Save this notebook by going to the “File” tab on the top of the notebook and click “Save Notebook as”. Alternatively, press Ctrl + Shift + S. Make sure to change “STUDENT” for your last name in the filename.
Submit this assignment by uploading it to the course Canvas web page. Go to the “In-class assignments” folder, find the assignment submission link for Day 1, and upload it there. Make sure you feel comfortable navigating within Jupyter.
Is there still time?
Feel free to start digging into the Pre-Class assignment for the next session. You will find it in the Canvas webpage.
See you next class!
© Copyright 2026, Division of Plant Science & Technology—University of Missouri
- O’Donoghue, S. I., Gavin, A.-C., Gehlenborg, N., Goodsell, D. S., Hériché, J.-K., Nielsen, C. B., North, C., Olson, A. J., Procter, J. B., Shattuck, D. W., Walter, T., & Wong, B. (2010). Visualizing biological data—now and in the future. Nature Methods, 7(S3), S2–S4. 10.1038/nmeth.f.301